The analysis of hypothetical AQM-34L missions showed the need for at least a basic aerodynamic model to predict endurance. Luckily Jason Hatton found a report on the BQM-34A performance, that included polars of the BQM-34A. These could be modified to represent the AQM-34L. However I'm not a performance or aerodynamics engineer, so I'm presenting the full analysis in the hope of receiving comments or ideas how to improve.
In 'Flight performance of the BQM-34A target drone with wing-tip mounted pods' by Boone/Blohm/Osborn (link), the authors performed in-flight measurements to develop new polars for the BQM-34A with mounted wing-tip pods, since no data on that subject was available. However, their new polars differed markedly from the manufacturer-measured polars, as is discussed below.
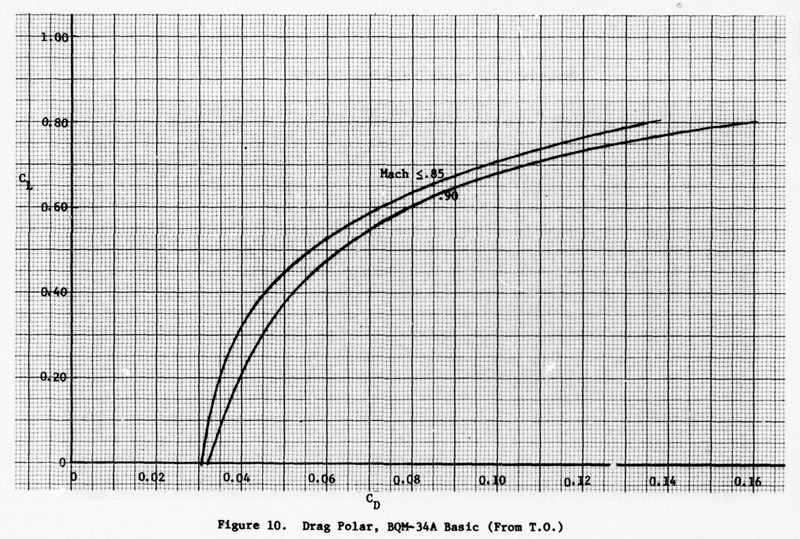
| The first polar set is from Technical Order 'BQM-34A Flight Controllerís Manual' (USAF) T.O. 21M-BQM-34A-1, dated 15 November 1973. Note that the first graph line is for speeds up to Mach 0.85, the second graph line is for Mach 0.90. I assume that the data was measured by the manufacturer, Teledyne-Ryan Aeronautical (TRA). Noteworthy is how close the lines are for CL=0, this is very favourable for high speed performance. | 
|
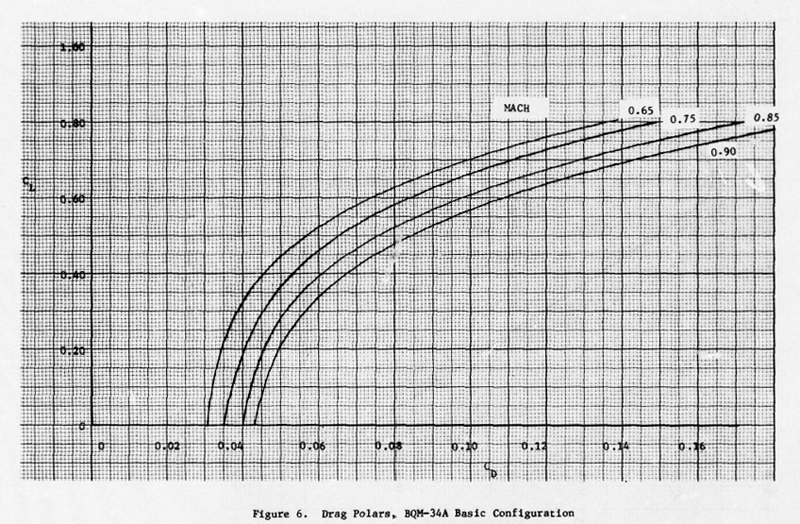
| The newly measured polars by Boone/Blohm/Osborn for the clean BQM-34A are for four Mach numbers, 0.65, 0.75, 0.85 and 0.90. The lines are almost equidistant or parallel. |
| I measured all six graph lines with Engauge, and combined them in one Excel graph to see the agreement or differences. It immediately becomes clear that the 'first' (left) lines of both sets agree quite nicely, but they are for different Mach numbers. The Tech Order graph line is for Mach 0.85, the USAF graph line is for Mach 0.65. The 'last' (right) graph lines for each set are both for Mach 0.90, but they differ vastly. The USAF measurements show much stronger Mach (compressibility) effects. The USAF document notes the differences too of course, but does not discuss the reasons in detail. It seems to suggests that the TRA data is too optimistic / favourable.
Possibly Ryan flattered the original data, or the new set was off due to measurements errors? Maybe the thrust measurements (derived from fuel flow) or the thrust model were off? It is difficult to tell who is right. I decided to start work with the 'new' set. | 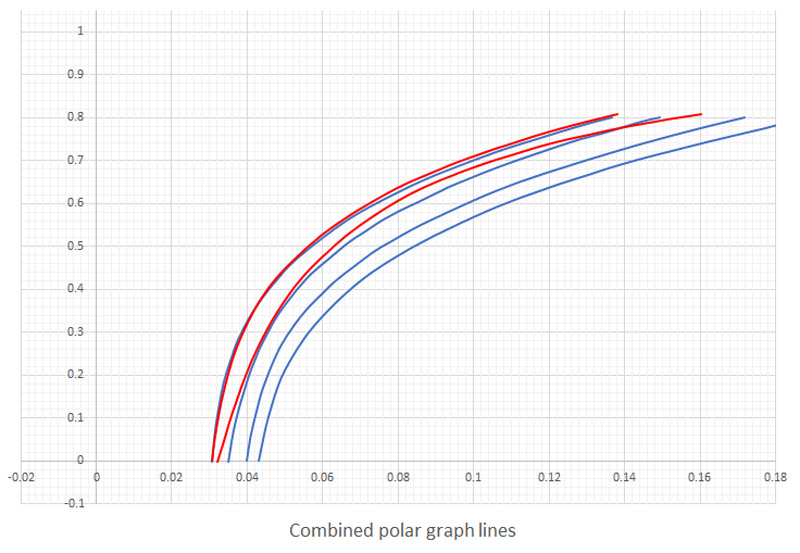
|
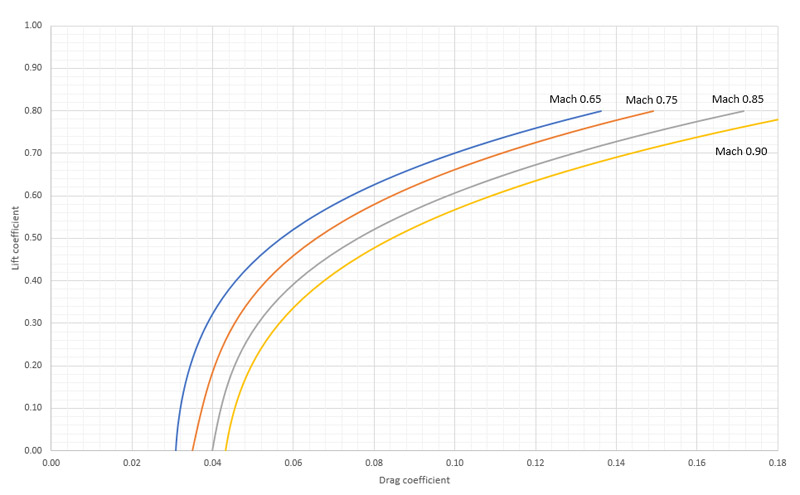
| Therefore, this set of BQM-34A polar graphs will be used for development of the AQM-34L polars. |
| The data can be reworked to a graph showing L/D versus lift coefficient. The peak L/D of 9 is not bad at all. But at high speed (say CL=0.1) the value is between 2 and 3. | 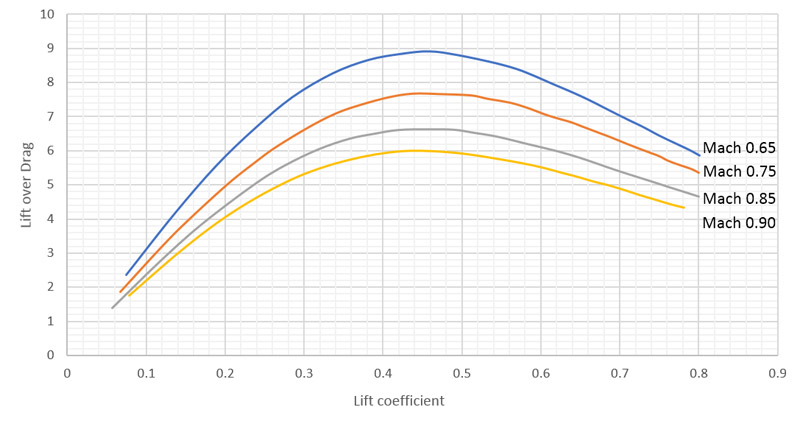
|
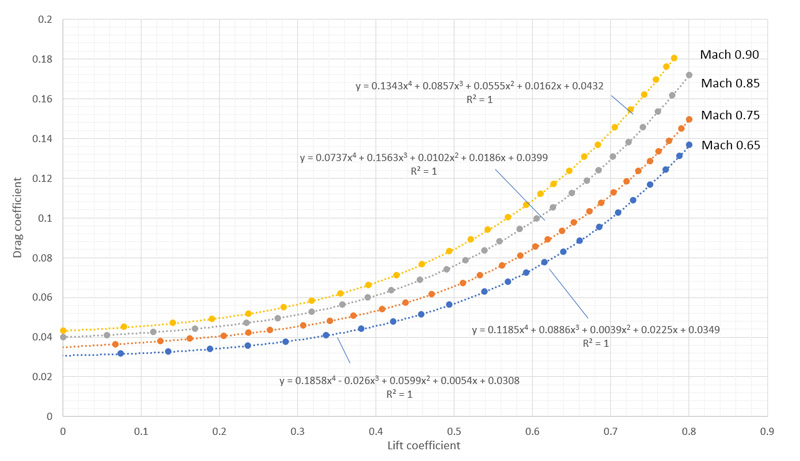
| Excel was used to draw curves through the transposed data (CL and CD were switched). The data gave a perfect R^2 = 1 fit for fourth-order polynomials, so I could not resist using them: Mach 0.65: CD = 0.03076 + 0.005432 * CL + 0.05992 * CL^2 - 0.02595 * CL^3 + 0.18583 * CL^4 Mach 0.75: CD = 0.03487 + 0.02246 * CL + 0.003904 * CL^2 + 0.08856 * CL^3 + 0.11848 * CL^4 Mach 0.85: CD = 0.03993 + 0.01862 * CL + 0.01022 * CL^2 + 0.1563 * CL^3 + 0.07369 * CL^4 Mach 0.90: CD = 0.04319 + 0.01625 * CL + 0.05546 * CL^2 + 0.08571 * CL^3 + 0.1343 * CL^4 Note that a standard parabolic model (CD = CD0 + CL^2/(pi*A*e) ) has a really bad fit and was pretty useless. However I later learned that CD0 should not be taken as a fixed value, but derived from the angle of attack dependant drag of a 2D wing section as measured in a wind tunnel or equivalent. |
The wing is the same as BQM-34A. That makes life quite easy. The 36 sqft area is 3.345 sqm in SI units.
The fuselage has a longer nose, a plug aft of the middle, and a longer main parachute cone. Therefore it has more surface area and thus more skin friction drag. It might have a different shape drag too because the fuselage is longer. There might be area-rule effect, since the constant section fuselage plug affects the area distribution along the longitudinal axis. Of all these effects, I can only calculate the skin friction drag. The other effects are quite small and thus ignored.
The balancing tail loads might be smaller or larger. The tail arm is larger, so smaller forces could be expected. But maybe the CG positions (or shifts) are less favourable, because of the large fuel tank behind the center of gravity. The BQM-34A polar does not specify a CG position, so it would all be guess work. The horizontal tails have endplates, again increasing the skin friction drag, and that can be calculated.
The overall mass is larger, but that is no part of the aerodynamic model.
Summarizing, the zero-lift drag will be corrected for the increased skin friction drag, and all other effects are ignored. This appears to be a reasonable approach.
Working nose to tail, the following areas are *roughly* calculated:
For the nose section between the radome and the inlet, I measured an average width of 0.569 m, a height of 0.533 m, and a length of 0.763 m (source: my 1/72 scale model :-). That makes 1.321 sqm area.
For the fuselage plug, I measured an average width of 0.749 m, a height of 0.893 m, and a length of 0.889 m (source: my 1/72 scale model the figure of 35" for the plug). That makes 2.297 sqm area.
For the longer main parachute cone, I measured a diameter in the middle of 0.432 m, and a length of 0.180 m (source: my 1/72 scale model). That makes 0.244 sqm area.
The small-type endplates are 0.540 m height and 0.324 m length if you measure the equivalent rectangular shape (source: my 1/72 scale model). That makes 0.700 sqm area for four sides.
The total extra area is 4.562 sqm, or 49.1 sqft.
Next question is what value of skin friction coefficient to use (CDf). The most practical and complete data is found in Stinton's 'Design of the aeroplane'. He suggests 0.003 for the wing, 0.0024 for the fuselage, 0.006 for the nacelle and 0.0025 for the tail planes (p208). I don't see it explicitely mentioned, but turbulent flow is assumed I think. Other sources present Reynolds-number dependent coefficients for turbulent skin friction, usually 0.072 * Re^-0.2 (Abbott & Von Doenhoff p99) or 0.074 * Re^-0.2 (Anderson, Fundamentals of Aerodynamics, p735), with the latter also noting a reduction for higher Mach numbers in a graph. Schlichting/Trockenbrodt's 'Aerodynamik Teil 1' contains a similar but clearer graph. For a fuselage of 8.712 m (measured on my 1/72 scale model) and a typical missions speed of 500 knots at sea level (257 m/s) I calculate a Reynolds number of 148 million. That gives Cf = 0.00167 - 0.00172. For the endplates of 0.324 m average length I calculate a Reynolds number of 5.5 million, and Cf = 0.0032 - 0.0033. I think the agreement is not too bad. I prefered to use the slightly higher Stinton numbers, to prevent being overly optimistic, and decided on 0.0025 as an average for all.
The extra drag can now be calculated: delta CD0 = Cf * Af / S = 0.0025 * 4.562 / 3.345 = 0.00341. This is 11.3% extra zero-lift drag if we take the polar for the lowest Mach-number. Earlier I used a rough estimate of 10%, so this result agrees well with expectations. By adding this zero-lift drag increase to the polars of the BQM-34A, we obtain: Mach 0.65: CD = 0.03417 + 0.005432 * CL + 0.05992 * CL^2 - 0.02595 * CL^3 + 0.18583 * CL^4 Mach 0.75: CD = 0.03828 + 0.02246 * CL + 0.003904 * CL^2 + 0.08856 * CL^3 + 0.11848 * CL^4 Mach 0.85: CD = 0.04334 + 0.01862 * CL + 0.01022 * CL^2 + 0.1563 * CL^3 + 0.07369 * CL^4 Mach 0.90: CD = 0.04660 + 0.01625 * CL + 0.05546 * CL^2 + 0.08571 * CL^3 + 0.1343 * CL^4 | 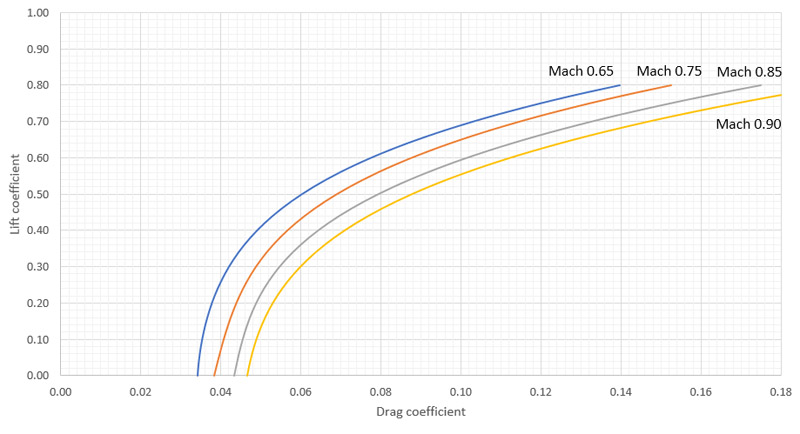
|
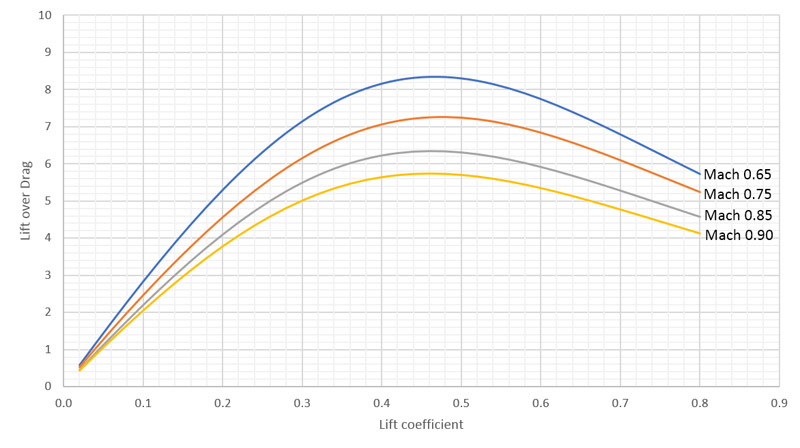
| The graph lines are reworked again to show L/D versus lift coefficient. The peak L/D of 8.4 is a bit lower. L/D at high speed (take CL=0.1) is still between 2 and 3. |
| I received a second data set, from an undetermined source, supposedly for the Model 147. Only the 'begin' (CL=0) and 'end' (CL=0.8 or 0.7) values were given. The curves were scaled averages of the AQM-34 polars. The extra data set is shown in red, together with the derived AQM-34L polars in blue.
Is this really the same aircraft, one wonders.. I guess not, since the effect of induced drag is so much smaller, whereas the zero-lift drag increases much stronger with Mach number. It suggests a larger wing, maybe one of the 'big wings' (27 ft and/or 32 ft span, instead of the ~13 ft wing span of the BQM-34A). | 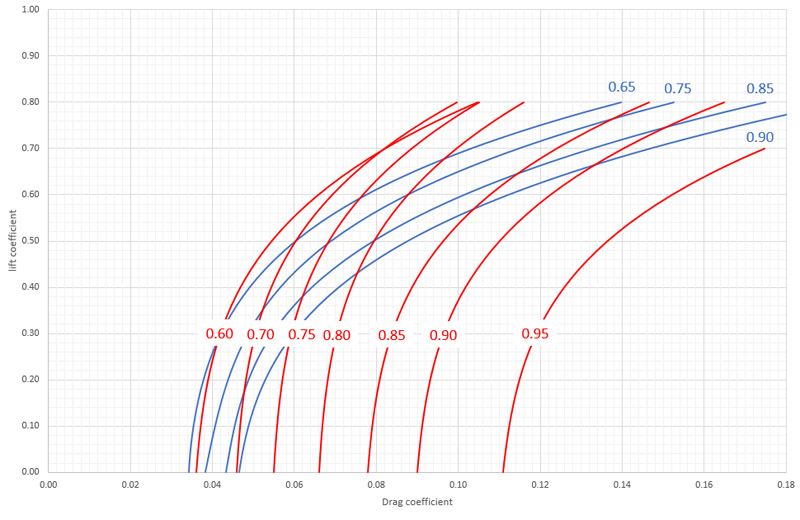
|